
Debugging
The Mojo extension for Visual Studio Code enables you to use VS Code's built-in debugger with Mojo code. This page describes the features available through the VS Code Mojo extension, as well as current limitations of the Mojo debugger.
You can install the Mojo extension from either the Visual Studio Code Marketplace or the Open VSX Registry. See Add the VS Code extension for more information.
To use the Mojo extension, you must also
install the mojo package—or, if you're developing for
the MAX framework, install the modular package, which
includes the mojo package.
For complete coverage of VS Code's debugging features, see Debugging in Visual Studio Code.
The mojo package includes the LLDB debugger and a
Mojo LLDB plugin. Together these provide the low-level debugging interface for
the Mojo extension. You can also use the mojo debug command to start a
command-line debugging session using LLDB or to launch a Mojo debugging session
in VS Code.
The mojo package also includes support for debugging Mojo programs running on
GPU. This requires some extra software and configuration. Currently GPU
debugging only works with NVIDIA GPUs. For details, see
GPU debugging.
Start debugging
There are several ways to start a debug session in VS Code.
To start debugging, you'll need to have a Mojo project to debug. There are a number of examples ranging from simple to complex in our GitHub repo.
Quick run or debug
If your active editor tab contains a Mojo file with an def main() entry point,
one of the quickest ways to run or debug it is using the Run or Debug button
in the Editor toolbar.
![]()
To start debugging the current file:
-
Open the Run or Debug dropdown menu and choose Debug Mojo File or Debug Mojo File in Dedicated Terminal.
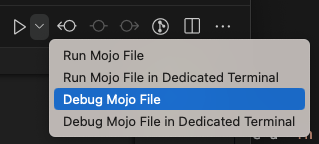
The two debug configurations differ in how they handle input and output:
-
Debug Mojo File launches the Mojo program detached from any terminal. Standard output and standard error output for the program are displayed in the Debug Console. You can't write to the program's standard input, but you can see the program's output and interact with the debugger in a single location.
-
Debug Mojo File in Dedicated Terminal creates a new instance of VS Code's integrated terminal and attaches the program's input and output to the terminal. This lets you interact with the program's standard input, standard output and standard error output in the terminal, while the Debug Console is used only for interactions with the debugger.
The Run or Debug button uses predefined launch configurations. There's
currently no way to modify the args, env, cwd or other settings for
programs launched with the Run or Debug configurations. If you need to
customize any of these things, see Edit launch
configurations.
After you choose one of the debug configurations, the button updates to show the debug symbol. Click the button to re-run the previous configuration.
![]() .
.
Run and Debug view
The Run and Debug view includes a button to launch debug sessions and a menu to select debug configurations. It also has areas to display current variables, watch expressions, the current call stack, and breakpoints.
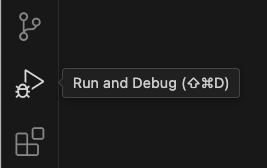
To open Run and Debug view, click the Run and Debug icon in the Activity Bar (on the left side of the VS Code window) or press Control+Shift+D (Command+Shift+D on macOS).
![]()
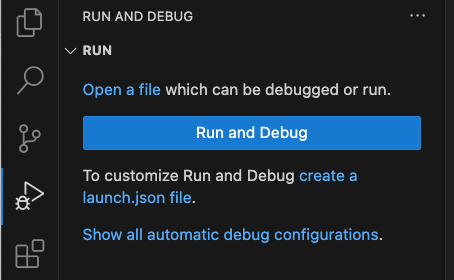
If you haven't created any launch configurations in the current project, VS Code shows the Run start view.
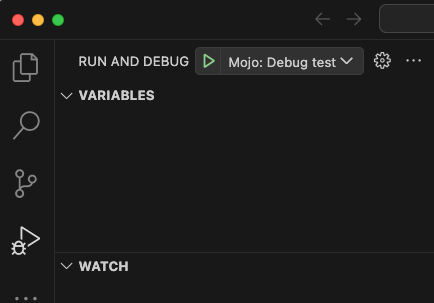
If you've already launched a debug session or created a launch.json file to
define launch configurations, you'll see the Launch configurations menu,
which lets you choose configurations and start debug sessions:

Other ways to start a debug session
There are a number of other ways to start a debug session.
Launching from the Command Palette
If you have a Mojo file open in your active editor, you can also start a debug session from the Command Palette.
-
Click View > Command Palette or press Control+Shift+P (Command+Shift+P on macOS).
-
Enter "Mojo" at the prompt to bring up the Mojo commands. You should see the same debug configurations described in Quick run or debug.
Launch from the File Explorer
To launch a debug session from the File Explorer view:
- Right-click on a Mojo file.
- Select a Mojo debug configuration.
You should see the same debug configurations described in Quick run or debug.
Debug with F5
Press F5 to start a debug session using the current debug configuration.
If you don't have any existing debug configurations available to select, and
your active editor contains a Mojo file with an def main() entry point,
pressing F5 will launch and debug the current file using the Debug Mojo
File action described in Quick run or debug.
Starting the debugger from the command line
Use the mojo debug command to start a debug session from the command line. You
can choose from two debugging interfaces:
-
With the
--vscodeflag,mojo debugstarts a debug session on VS Code if it's running and the Mojo extension is enabled. -
Without the
--vscodeflag,mojo debugstarts a command-line LLDB debugger session.
You can choose to build and debug a Mojo file, run and debug a compiled binary, or to attach the debugger to a running process.
For a full list of command-line options, see the mojo debug reference
page.
Start a debug session from the command line
With VS Code open, run the following command (either from VS Code's integrated terminal or an external shell):
mojo debug --vscode myproject.mojoOr to debug a compiled binary:
mojo debug --vscode myprojectFor best results, build with the -O0 -g command-line options when you build a
binary that you intend to debug—this produces a binary with full debug info.
(When you call mojo debug on a Mojo source file, it includes debug
information by default.) See the mojo build reference page
for details on compilation options.
Attach the debugger to a running process from the command line
You can also attach the debugger to a running process by specifying either the process ID or process name on the command line:
mojo debug --vscode --pid <PROCESS_ID>Or:
mojo debug --vscode --process-name <PROCESS_NAME>Launch configurations
VS Code launch configurations let you define setup information for debugging your applications.
The Mojo debugger provides the following launch configuration templates:
-
Debug current Mojo file. Launches and debugs the Mojo file in the active editor tab. Effectively the same as the Debug Mojo File action described in Quick run or debug, but with more configuration options.
-
Debug Mojo file. Like the previous entry, except that it identifies a specific file to launch and debug, no matter what file is displayed in the active editor.
-
Debug binary. This configuration operates on a prebuilt binary, which could be written in any mixture of languages supported by LLDB (Mojo, C, C++, etc.). You need to set the
programfield to the path of your binary. -
Attach to process. Launches a debug session attached to a running process. On launch, you choose the process you want to debug from a list of running processes.
You can edit any of these templates to customize them. All VS Code launch configurations must contain the following attributes:
name. The name of the launch configuration, which shows up in the UI (for example, "Run current Mojo file").request. Can be eitherlaunch(to run a program from VS Code) orattach(to attach to and debug a running file).type. Usemojo-lldbfor the Mojo debugger. Usemojo-cuda-gdbto debug on GPU.
In addition, Mojo launch configurations can contain the following attributes:
args. Any command-line arguments to be passed to the program.cwd. The current working directory to run the program in.description. A longer description of the configuration, not shown in the UI.env. Environment variables to be set before running the program.mojoFile. Path to a Mojo file to launch and debug.pid. Process ID of the running process to attach to.program. Path to a compiled binary to launch and debug, or the program to attach to.runInTerminal. True to run the program with a dedicated terminal, which allows the program to receive standard input from the terminal. False to run the program with its output directed to the Debug Console.
Mojo GPU launch configurations can contain the following attributes:
-
breakOnLaunch. Set to true to automatically break when a GPU kernel launches. -
initCommands. An array of commands to issue to the debugger on startup. To use the classic CUDA-GDB debugger backend, add the following lines to your configuration:"initCommands": [ "set environment CUDBG_USE_LEGACY_DEBUGGER=1" ], -
legacyDebugger. Set to true to use the classic debugger backend.
If configuration is a launch request, the configuration must include either
the mojoFile or program attribute.
For attach requests, the configuration must include either the pid or
program attribute.
VS Code performs variable substitution on the launch configurations. You can
use ${workspaceFolder} to substitute the path to the current workspace, and
${file} to represent the file in the active editor tab. For a complete list
of variables, see the VS Code Variables
reference.
For more information, see the VS Code documentation for Launch configurations.
Edit launch configurations
To edit launch configurations:
-
If the Run and Debug view isn't already open, click the Run and Debug icon in the Activity Bar (on the left side of the VS Code window) or press Control+Shift+D (Command+Shift+D on macOS).
-
Create or open the
launch.jsonfile:- If you see the Run start view, click create a launch.json file.
- If you already have launch configurations set up, click the gear icon
next to the Launch configurations menu.
-
Select Mojo from the list of debuggers.
VS Code opens the new launch.json file in an editor tab, with templates for
some common debug actions. Click Add configuration to add a new
configuration template.
Using the debugger
When a debug session is running, use the debug toolbar to pause, continue, and step through the program.
![]()
The buttons on the toolbar are:
-
Continue/Pause: If the program is stopped, resume the normal execution of the program up to the next breakpoint, signal or crash. Otherwise, pause all the threads of the program at once.
-
Step Over: Execute the next line of code without stopping at function calls.
-
Step Into: Execute the next line of code and stop at the first function call. If the program is stopped just before a function call, steps into the function so you can step through it line-by-line.
-
Step Out: Finish the execution of the current function and stop right after returning to the parent function.
-
Restart: If this is a
launchsession, terminate the current program and restart the debug session. Otherwise, detach from the target process and reattach to it. -
Stop: If this is a
launchsession, terminate the current program. Otherwise, detach from the target process without killing it.
The debugger currently has the following limitations:
-
No support for breaking automatically on Mojo errors.
-
When stepping out of a function, the returned value is not displayed.
-
LLDB doesn't support stopping or resuming individual threads.
Breakpoints
The Mojo debugger supports setting
standard breakpoints,
logpoints,
function breakpoints,
data breakpoints,
and
triggered breakpoints,
as described in the VS Code documentation. The Mojo debugger also supports
error breakpoints (also known as "break on raise"), which break whenever a
raise statement is executed.
When debugging Mojo code, the debugger doesn't support conditional breakpoints based on an expression (it does support hit counts, which VS Code classifies as a kind of conditional breakpoint).
When editing a breakpoint, you're offered four options:
- Expression. Set a conditional breakpoint (not currently supported).
- Hit Count. Add a hit count to a breakpoint (supported).
- Log Message. Add a logpoint (supported)
- Wait for Breakpoint. Add a triggered breakpoint (supported).
Set a hit count breakpoint
A hit count breakpoint is a breakpoint that only breaks execution after the debugger hits it a specified number of times.
To add a hit count breakpoint:
- Right click in the left gutter of the editor where you want to place the breakpoint, and select Add Conditional Breakpoint.
- Select Hit Count from the menu and enter the desired hit count.
To change an existing breakpoint to a hit count breakpoint:
- Right click on the breakpoint in the left gutter of the editor and select Edit breakpoint.
- Select Hit Count from the menu and enter the desired hit count.
You can also edit a breakpoint from the Breakpoints section of the Run and Debug view:
- Right-click on the breakpoint and select Edit Condition, or,
- Click the Edit Condition icon next to the breakpoint.
This brings up the same menu, next to the breakpoint in the editor tab.
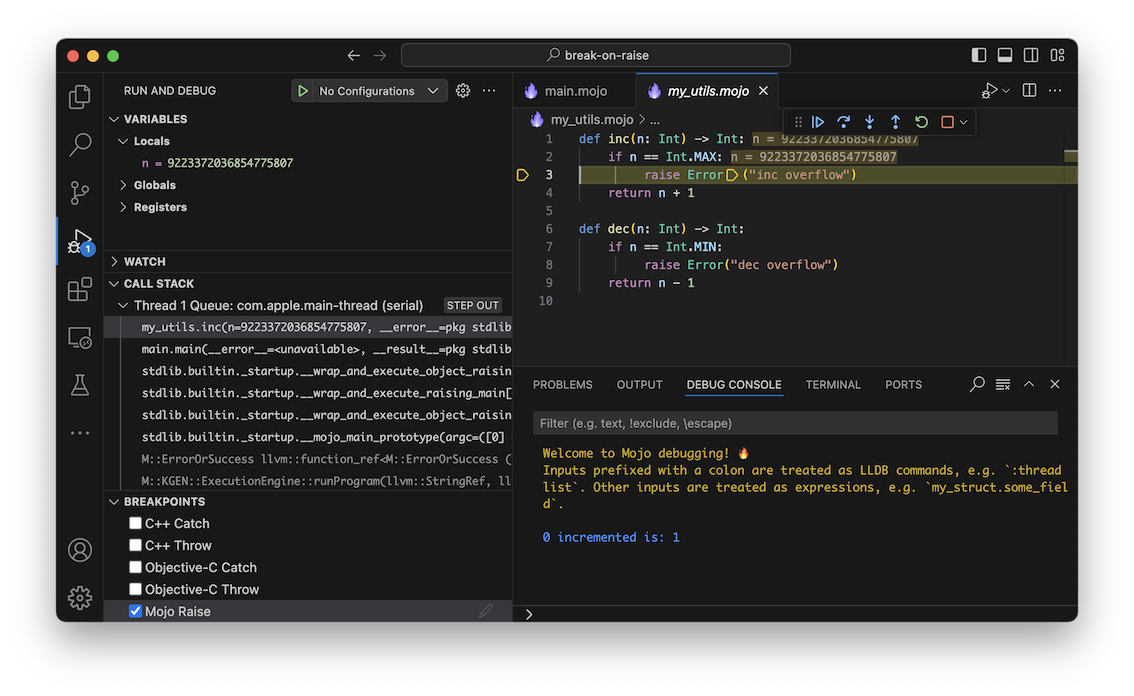
Enable error breakpoints
You can enable and disable error breakpoints in VS Code by selecting "Mojo
Raise" in the Breakpoints section of the Run and Debug view. If enabled
during debugging, executing a raise statement causes the debugger to stop
execution and highlight the line of code where the error was raised.
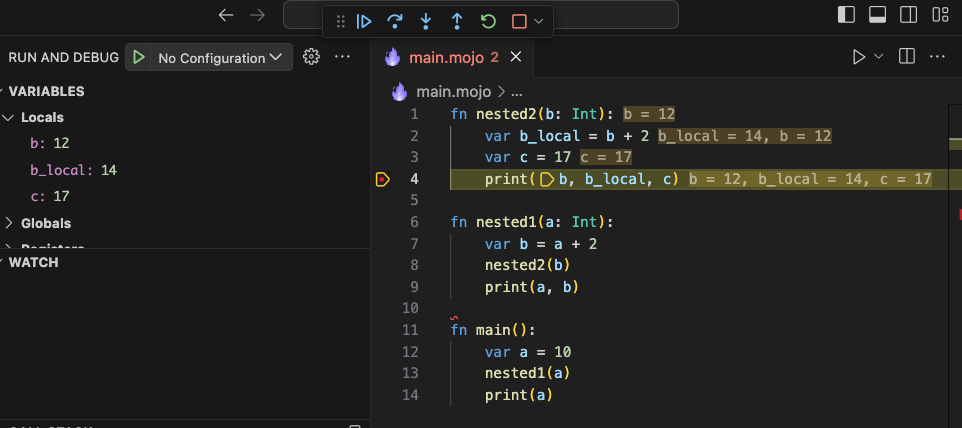
View local variables
When a program is paused in the debugger, the editor shows local variable values inline. You can also find them in the Variables section of the Run and Debug view.
View the call stack
When a program is paused in the debugger, the Run and Debug view shows the current call stack. (You may see multiple call stacks, one for each active thread in the program.)
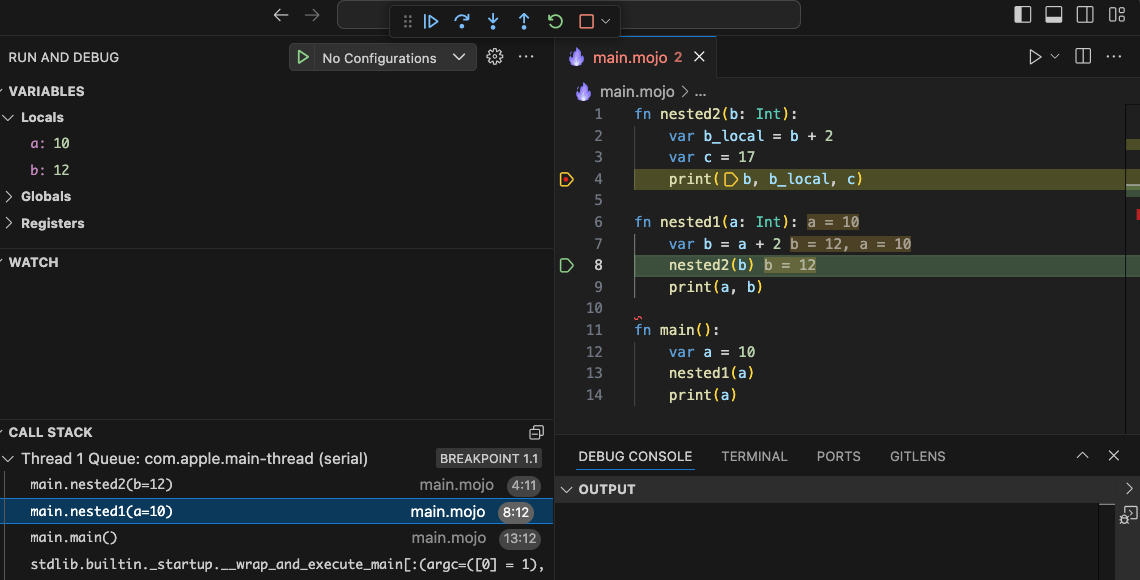
The Call Stack section of the Run and Debug view shows a stack frame for
each function call in the current call stack. Clicking on the name of the
function highlights the current line in that function. For example, in Figure
5, the program is paused at a breakpoint in nested2(), but the parent
function, nested1() is selected in the call stack. The editor highlights the
current line in nested1() (that is, the call to nested2()) and shows the
current local variable values for nested1().
Use the Debug Console
The Debug Console gives you a command-line interface to the debugger. The Debug Console processes LLDB commands and Mojo expressions.
Anything prefixed with a colon (:) is treated as an LLDB command. Any other
input is treated as an expression.
Currently Mojo expressions are limited to inspecting variables and their fields.
The console also supports subscript notation (vector[index]) for certain data
structures in the standard library, including List and SIMD.
In the future, we intend to provide a way for arbitrary data structures to support subscript notation in the Debug Console.
Tips and tricks
There are several features in the standard library that aren't directly related to the debugger, but which can help you debug your programs. These include:
- Programmatic breakpoints.
- Setting parameters from the Mojo command line.
Set a programmatic breakpoint
To break at a specific point in your code, you can use the built-in
breakpoint() function:
if some_value.is_valid():
   do_the_right_thing()
else:
   # We should never get here!
   breakpoint()
If you have VS Code open and run this code in debug mode (either using VS Code
or mojo debug), hitting the breakpoint() call causes an error, which
triggers the debugger.
Set parameters from the Mojo command line
You can use the sys module to retrieve
parameter values specified on the Mojo command line. Among other things, this
is an easy way to switch debugging logic on and off. For example:
from std.sys import is_defined

def some_function_with_issues() raises:
    # ...
    comptime if is_defined["DEBUG_ME"]():
        breakpoint()
To activate this code, use the -D command-line
option to define DEBUG_ME:
mojo debug -D DEBUG_ME main.mojoThe is_defined() function returns a compile-time true or false value based on
whether the specified name is defined. Since the breakpoint() call is inside a
comptime if statement,
it is only included in the compiled code when the DEBUG_ME name is defined on
the command line.
Troubleshooting
error: can't connect to the RPC debug server socket
If using mojo debug --vscode gives you the message error: can't connect to the RPC debug server socket: Connection refused, try the following possible
fixes:
- Make sure VS Code is open.
- If VS Code is already open, try restarting VS Code.
- If there are other VS Code windows open, try closing them and then restarting. This error can sometimes occur when multiple windows have opened and closed in certain orders.
error: couldn't get a valid response from the RPC server
If using mojo debug --vscode gives you the message error: couldn't get a valid response from the RPC server, try the following possible fixes:
- Make sure VS Code is open to a valid Mojo codebase. This error can sometimes happen if the VS Code window is open to some other codebase.
- If there are multiple VS Code windows open, try closing all but the one you wish to debug in.
- Restart VS Code.
- Reinstall the SDK and restart VSCode.
- If you are working on a development version of the SDK, make sure that all SDK tools are properly built with your build system, and then reload VS Code.
- As a last resort, restarting your entire computer can fix this problem.
If these steps don't help, please file an issue. We'd love your help identifying possible causes and fixes!
Was this page helpful?
Thank you! We'll create more content like this.
Thank you for helping us improve!