
GPU profiling with Nsight Systems
Nsight Systems (nsys) is a system-wide performance analysis tool for
visualizing application behavior on NVIDIA GPUs. It captures the full execution
timeline including CPU activity, CUDA API calls, GPU kernels, and memory
operations. This page describes how to use nsys to profile systems built with
the MAX framework and view the results with the Nsight Systems application.
You should use nsys when you need to understand where time is being spent
across your application, such as which kernels are slow. You can then deep-dive
into specific kernel performance
Nsight Compute,
or our purpose-built
kbench tool
that helps you benchmark, autotune, and analyze Mojo kernel performance.
Requirements
Verify your nsys installation
Nsight Systems (nsys) is included with the CUDA Toolkit, but you can also
install it separately.
Log into your machine with an NVIDIA GPU and check if nsys is already
available:
which nsysIf not found, but you have CUDA installed, try adding the CUDA bin directory to your PATH. For example:
export PATH=/usr/local/cuda/bin:$PATHOtherwise, you can download it from NVIDIA's Nsight Systems page or install it with your package manager. For example, on Ubuntu/Debian:
sudo apt-get install nsight-systemsProfile a MAX model
When profiling code built with MAX, you have to explicitly enable profiling by
setting the MODULAR_ENABLE_PROFILING environment variable to detailed or by
calling
InferenceSession.gpu_profiling()
before you load your model.
In most cases, you'll probably use MODULAR_ENABLE_PROFILING so you don't have
to modify your code. For example, you can profile my_program.py with this
command:
MODULAR_ENABLE_PROFILING=detailed \
  nsys profile --trace=cuda,osrt,nvtx \
  --cuda-memory-usage=true \
  --output=profile \
  --force-overwrite=true \
  python my_program.py
If you don't have a MAX model to profile, you can try it with one of our code
examples (requires pixi):
-
Clone the Modular repo and navigate to the examples:
git clone https://github.com/modular/modular.git cd modular/max/examples/custom_ops -
Profile the top-k custom op example:
MODULAR_ENABLE_PROFILING=detailed \
  nsys profile --trace=cuda,osrt,nvtx \
  --cuda-memory-usage=true \
  --output=profile \
  --force-overwrite=true \
  pixi run top_k
This creates a profile.nsys-rep file in the current directory (you can change
the filename and path with the --output option).
To view the results, skip to the view the profile section.
For details about the nsys command options, see the Nsight Systems
User Guide.
Profile a MAX endpoint
To profile a MAX model endpoint, use nsys launch instead of nsys profile.
This allows you to start the server and start profiling only when you're
ready to run inference.
For example, here's how to profile a benchmark workload:
-
Make sure you're in a project environment with the
modularpackage installed. -
The next step deploys Google Gemma 3, so in order for MAX to download the model weights, you must first agree to the Gemma 3 license and set your HF Access Token:
export HF_TOKEN="hf_..." -
Start the MAX server (
max serve) withnsys launch(this doesn't start profiling yet):MODULAR_ENABLE_PROFILING=detailed \ numactl --cpunodebind=2 --membind=2 \ nsys launch \ --trace=cuda,nvtx,osrt \ --cuda-memory-usage=true \ --trace-fork-before-exec=true \ max serve --model google/gemma-3-12b-it -
Wait until the server is ready—you'll see a message like this in your terminal:
🚀 Server ready on http://0.0.0.0:8000 (Press CTRL+C to quit) -
Open a second terminal in the same environment and start profiling:
nsys start \
  --force-overwrite=true \
  --output=server_profile \
  --session=$(nsys sessions list -p false | awk '{print $1}')
You should see this message in the first terminal:
Collecting data... -
In the second terminal, use
max benchmarkto run a benchmark workload:max benchmark \ --model google/gemma-3-12b-it \ --backend modular \ --endpoint /v1/chat/completions \ --dataset-name sonnet \ --num-prompts 500 \ --sonnet-input-len 550 \ --output-lengths 256 \ --sonnet-prefix-len 200 -
Once the benchmark completes, stop profiling from the second terminal:
nsys stop --session=$(nsys sessions list -p false | awk '{print $1}')
This creates a server_profile.nsys-rep file in the current directory
(the filename and path is specified by the nsys start --output option).
View the profile
The best way to inspect the profile results is to open the .nsys-rep file in
the Nsight Systems GUI
application.
If you generated the profile on a local desktop environment, you can open the application with this command:
nsys-ui profile.nsys-repIf you generated the profile on a remote system, copy the .nsys-rep file to
your local machine and open Nsight Systems locally:
-
Install NVIDIA Nsight Systems on your local system (available for Windows, macOS, and Linux).
-
Copy the
profile.nsys-repfile to your local machine (such as viascp). -
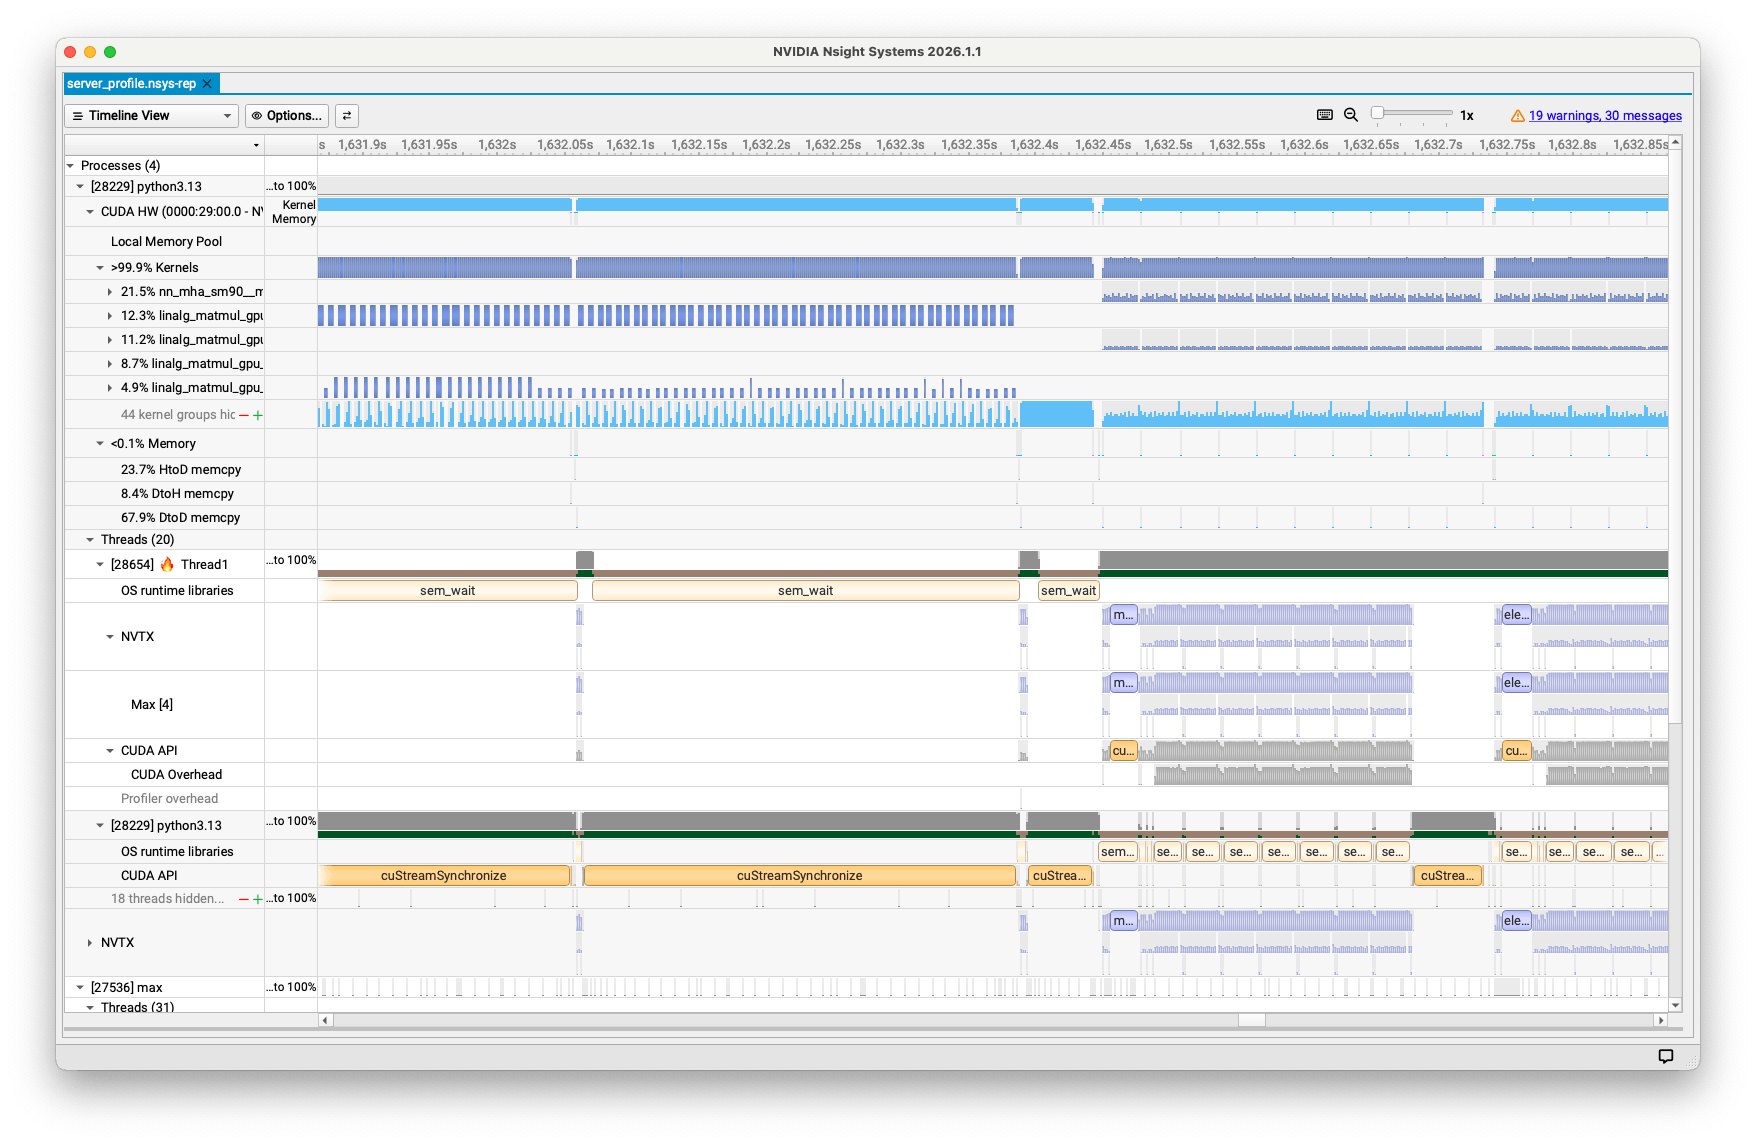
Double-click the
.nsys-repfile to open it in Nsight Systems. You should see a timeline showing the profile results, similar to the example in figure 1.
Alternatively, you can print a summary of the profile results in the terminal:
nsys stats profile.nsys-repFor detailed instructions for analyzing the profile results, see the Nsight Systems Post-Collection Analysis Guide.
Enable MAX profiling markers
To enable MAX profiling markers, set the MODULAR_ENABLE_PROFILING environment
variable to detailed, call the
InferenceSession.gpu_profiling()
method, or add the --gpu-profiling option to max serve.
Enable profiling with an environment variable
Here's an example of how to enable MAX profiling markers with the
MODULAR_ENABLE_PROFILING environment variable:
MODULAR_ENABLE_PROFILING=detailed \
  nsys profile --trace=cuda,nvtx,osrt \
  python my_program.py
MODULAR_ENABLE_PROFILING accepts the following values:
off(default): Disables MAX profiling markers.on: Enables MAX profiling markers with NVTX markers for kernel correlation.detailed: Enables MAX profiling markers with additional Python-level NVTX markers.
Enable profiling with Python
You can enable MAX profiling markers from Python by calling the
InferenceSession.gpu_profiling()
method before you load your model:
from max.engine import InferenceSession

session = InferenceSession(devices=[GPU()])
session.gpu_profiling("detailed")
Beware that gpu_profiling() overrides the MODULAR_ENABLE_PROFILING
environment variable if also used, and you must call it before load().
Enable profiling with a max CLI option
You can also enable MAX profiling markers by adding the --gpu-profiling
option to max serve. For example:
max serve --gpu-profiling detailed \
  --model google/gemma-3-12b-it
Beware that --gpu-profiling overrides the MODULAR_ENABLE_PROFILING
environment variable if also used.
NUMA binding with numactl
Multi-socket systems (systems with 2 or more physical CPUs) use a non-uniform
memory access (NUMA) architecture, in which each CPU can access the memory
within other CPUs. However, it's always faster for a CPU to access the memory
on its own CPU. So if you're profiling a program on a multi-socket system, you
should bind the process to a specific CPU and memory node using
numactl to get more consistent
profiling results.
First, install numactl if it's not already available:
# Ubuntu/Debian
sudo apt-get install numactl

# RHEL/CentOS/Fedora
sudo dnf install numactl
For example, you can bind your process to NUMA node 2 with this command:
numactl --cpunodebind=2 --membind=2 \
  nsys profile --trace=cuda,nvtx \
  python my_program.py
The --cpunodebind=2 option restricts the process to run only on CPUs in NUMA
node 2, while --membind=2 allocates memory only from that same node.
You should adjust --cpunodebind and --membind based on your system
topology—use numactl -H to view the system's NUMA topology.
On single-CPU-socket systems, you can omit numactl entirely.
See also
-
Nsight Systems Post-Collection Analysis Guide: Detailed instructions for analyzing the
nsysprofile results. -
Kernel profiling with Nsight Compute: A companion to Nsight Systems for kernel-level profiling on NVIDIA GPUs.
-
kbenchtool: A Python-based toolkit that builds and executes Mojo kernel benchmarks across a grid of parameter combinations to help you autotune and analyze Mojo kernel performance on any hardware.
Was this page helpful?
Thank you! We'll create more content like this.
Thank you for helping us improve!